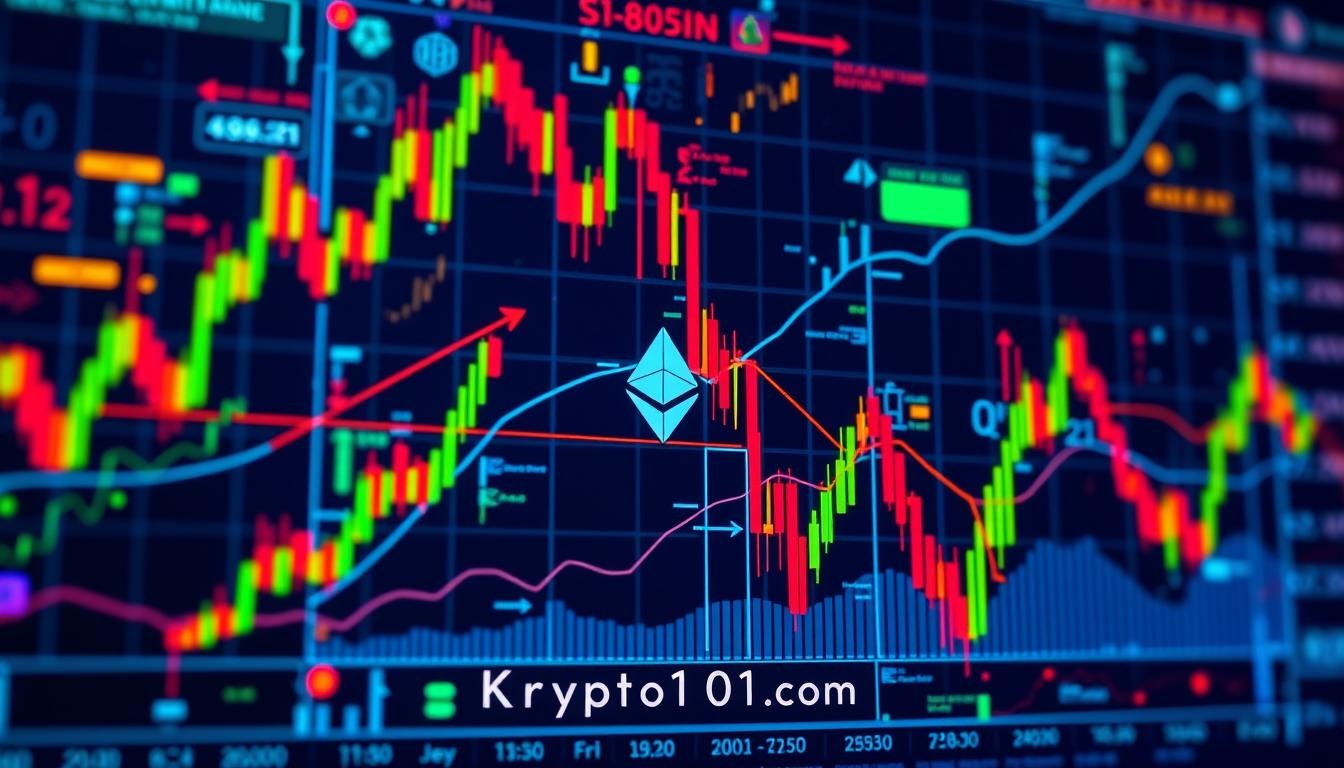
Welcome to the exciting world of cryptocurrency. Digital assets have changed the financial scene. For beginners, knowing how to read crypto charts is key to smart investing. These charts show a coin’s price and market data, giving insights into trends and patterns.
In this guide, we’ll cover the basics of crypto charts. We’ll look at different types, their parts, and how to understand them. Whether you’re new or experienced, learning to analyze crypto charts will help you make better choices.
Key Takeaways
- Cryptocurrency charts offer a window into the market’s dynamics, providing crucial insights for informed trading decisions.
- Understanding the different types of crypto charts, including candlestick, line, and bar charts, is essential for effective technical analysis.
- Identifying key chart patterns and indicators can help you detect potential buy and sell signals, as well as support and resistance levels.
- Analyzing trading volume and market capitalization can provide valuable context for interpreting price movements in the crypto market.
- Incorporating the principles of technical analysis, such as Dow Theory, can further enhance your ability to make data-driven investment choices.
What is Cryptocurrency?
Cryptocurrency is a digital money that uses secret codes to keep transactions safe. It doesn’t need banks and you can’t hold it in your hand. Bitcoin, the first one, started a big change. Now, there are thousands of other digital coins called altcoins.
Cryptocurrencies use blockchain technology. This is a network that checks and keeps track of money moves. It’s safe because no one person controls it. Instead, many computers work together to keep everything honest and clear.
Knowing how cryptocurrency works is key to understanding the crypto market. It helps you make smart choices when you trade or invest. Learning about this digital money can give you a big advantage.
“Cryptocurrencies represent the future of money, a paradigm shift in the way we think about and use currency.”
Whether you’re new or have experience, exploring bitcoin and altcoins is exciting. Learning about blockchain technology helps you understand the crypto world better. It also lets you use crypto charts to make smart choices.
The Importance of Crypto Charts
Crypto charts show a cryptocurrency’s price and market data over time. They give insights into market mood, price trends, and trading volume. This helps traders and investors make smart choices. Looking at crypto charts is key to understanding trends and making strategic investments.
Unlocking Market Insights
Crypto charts are full of information for the volatile cryptocurrency market. By studying them, you can spot price patterns and trends. You can also find support or resistance levels. Knowing the market dynamics is crucial for smart trading and risk reduction.
Spotting Opportunities and Risks
Crypto charts help you find the right times to buy or sell. They show bearish or bullish signals, helping you adjust your strategy. By paying attention to crypto charts, you can make better decisions about your digital assets.
Analyzing Cryptocurrency Trends
Crypto charts clearly show a cryptocurrency’s price changes over time. They help you see long-term trends, like steady growth or market consolidation. Knowing these trends is vital for making smart market decisions and aligning your investments.
In conclusion, crypto charts are essential for traders and investors in the cryptocurrency market. By understanding their importance and using the insights they offer, you can make better decisions. This can help you manage risks and possibly increase your investment returns.

Introduction to Crypto Charts
To understand the world of cryptocurrency, knowing about crypto charts is key. The main types are line charts, bar charts, and candlestick charts. Each gives a different view of market data and price changes.
Line Charts
Line charts are simple and well-known. They show the closing price of a cryptocurrency over time. This helps traders see the price trend and find support and resistance levels.
Bar Charts
Bar charts offer more details. They show the opening, closing, high, and low prices for each period. This extra info helps traders understand the market better and make smarter choices.
Candlestick Charts
Candlestick charts are the most detailed and useful. Each candlestick shows the price range in a time frame. The body shows the opening and closing prices, and the wicks show the highs and lows. This detail helps traders spot price patterns and make better trades.
| Chart Type | Key Features | Advantages |
|---|---|---|
| Line Charts | Displays the closing price over time | Simple and easy to interpret |
| Bar Charts | Shows opening, closing, high, and low prices | Provides more detailed market information |
| Candlestick Charts | Illustrates the price range, including opening and closing prices | Offers the most comprehensive view of market dynamics |
Learning about these crypto charts helps you analyze market trends. It also helps you spot trading chances and make smart investment choices in the crypto world.
Types of Crypto Charts
Traders and investors use different chart types to understand the crypto market. The main ones are line charts, bar charts, and candlestick charts. Each type helps in seeing the market’s price trends and dynamics.
Line Charts
Line charts are simple and show a coin’s price over time. They connect closing prices to show the trend. These charts help spot big market changes and key support and resistance levels.
Bar Charts
Bar charts give a detailed look at the market. They show the opening, closing, high, and low prices for each period. The bars show the price range, helping to see market volatility and support and resistance levels.
Candlestick Charts
Candlestick charts give a full view of market dynamics. They show the price range with the body showing the price difference. Patterns like doji and hammer offer insights into market mood and trend changes.
Knowing how to read these charts is key for traders in the crypto market. By learning to read line charts crypto, bar charts crypto, and candlestick charts crypto, you can better understand the market. This knowledge helps in making smart trading choices.

“Technical analysis is the study of market action, primarily through the use of charts, for the purpose of forecasting future price trends.” – John J. Murphy, Technical Analysis of the Financial Markets
Key Elements in a Crypto Chart
Understanding crypto charts is key for smart trading. These charts show market insights like price levels and trends. They help you spot support and resistance lines and track trading volume.
Price Levels
Crypto charts show a cryptocurrency’s price changes over time. Watching these prices helps you find good times to buy or sell.
Support and Resistance Lines
Support and resistance lines are horizontal lines on charts. They show where prices have trouble moving. These lines help guide your trading decisions.
Trading Volume
Trading volume shows how much of a cryptocurrency is being traded. It helps you understand market interest and the strength of price movements.
Trends
Crypto charts show the market’s direction, whether it’s going up or down. Knowing the trend helps you make better trading choices.
Chart Patterns
Charts often show patterns like triangles and head and shoulders. These patterns can predict market changes, helping you make smart moves.
Learning about these crypto chart elements helps you trade with confidence. You’ll make better decisions and increase your chances of success.
| Key Element | Description |
|---|---|
| Price Levels | The fluctuating prices of a cryptocurrency over time, providing insights into potential support and resistance points. |
| Support and Resistance Lines | Horizontal lines indicating prices at which a cryptocurrency’s price has historically found difficulty moving lower (support) or higher (resistance). |
| Trading Volume | The number of units of a cryptocurrency traded during a specific time frame, indicating market interest and the strength of price movements. |
| Trends | The overall direction of the market, whether it is bullish (upward trending) or bearish (downward trending). |
| Chart Patterns | Various patterns, such as triangles, head and shoulders, and double tops or bottoms, which can signal potential trend reversals or continuations. |

By understanding these key elements of crypto charts, you’ll be better equipped to navigate the cryptocurrency market with confidence and make informed trading decisions.
Understanding Candlestick Patterns
Candlestick patterns are key for analyzing the crypto market. They include doji, hammer, engulfing, and shooting star patterns. These patterns help spot when trends might change or keep going, guiding your trades.
These patterns started in Japan in the 18th century for rice trading. Munehisa Homma, a Japanese rice trader, introduced them to the world. He used them to track rice prices at the Dojima Rice Exchange.
These patterns give clues about market mood and future price moves. They help traders make smart choices. Looking at different time frames can give more details, helping traders see the big picture.
Even with their value, candlestick patterns aren’t perfect. Traders need to use them with other methods and strategies to succeed.
Common Candlestick Patterns
- Bearish Engulfing Pattern: A long red real body engulfing a small green real body.
- Bullish Engulfing Pattern: A long white real body engulfing a small black real body.
- Bearish Evening Star: The last candle opens below the previous day’s small real body.
- Bearish Harami: A small black real body completely inside the previous day’s white real body.
- Rising Three Methods (Bullish): A pattern starting with a long white day followed by smaller real bodies moving the price lower for three consecutive days before another long white day breaking above the high of day one.
- Falling Three Methods (Bearish): Starts with a strong down day and continues with three small real bodies that make upward progress but stay within the range of the first big down day, completing with another large downward move breaking below the low of the first down day.
Learning about these patterns can help traders understand the crypto market better. It can lead to more informed trading decisions.

Deciphering Line and Bar Charts
As a crypto trader, it’s key to know how to read line and bar charts. Line charts show a crypto’s price trend clearly. They help spot support and resistance levels that can affect future prices.
Bar charts, meanwhile, give more info like opening and closing prices, and highs and lows. This extra data helps you grasp market dynamics better. It aids in making smarter trading choices based on trends and volatility.
Analyzing Support and Resistance Levels
Line and bar charts are great for finding support and resistance levels. Support levels are where a crypto usually sees buying interest. Resistance levels are where it faces selling pressure. Knowing these can help you predict price changes and adjust your trading plans.
| Characteristic | Line Chart | Bar Chart |
|---|---|---|
| Price Trend | Clear visualization of price movement over time | Provides additional data points (open, high, low, close) to understand market dynamics |
| Support and Resistance Levels | Easily identifiable | Offers more detailed information to confirm support and resistance levels |
| Volatility | Less detailed information on price swings | Highlights the range of price movement within a given time frame |
Learning to analyze line and bar charts can give you deep insights into crypto prices. It’s a vital skill for both new and seasoned traders. Understanding these charts helps you navigate the fast-changing crypto market.
“The ability to read and interpret cryptocurrency charts is a fundamental skill for any serious trader. It allows you to identify patterns, trends, and opportunities that can give you an edge in the market.”
How to read cryptocurrency charts
Learning to read cryptocurrency charts is key for traders and investors. It helps you understand market trends and price movements. By knowing different chart types and technical analysis, you can spot trading opportunities.
The candlestick chart is a popular choice in crypto. It shows market activity over time, from 1 minute to 1 month. Each candlestick has the opening, closing, high, and low prices, giving a full view of the market.
Other charts like line charts and bar charts are also used. Line charts are simple to read for trends. Bar charts show price ranges, showing market volatility.
| Chart Type | Key Features |
|---|---|
| Candlestick Chart | Displays opening, closing, high, and low prices for a specific time period |
| Line Chart | Provides a clear visual representation of market trends |
| Bar Chart | Illustrates the range of prices for each time period, highlighting market volatility |
Understanding trends is crucial. Upward trends mean the market is bullish. Downward trends show a bearish market. Knowing these trends helps you decide when to buy, sell, or hold.
Studying candlestick patterns also helps. Patterns like doji and hammer can signal trend changes. This gives you insight into market sentiment and price movements.
By learning about chart types, trends, and patterns, you can develop a strong cryptocurrency chart analysis strategy. This, along with knowledge of trading volume and technical indicators, will help you make better decisions in the crypto market.
“Successful cryptocurrency trading is not just about luck; it’s about developing the skills to read and interpret the market’s visual cues. Mastering the art of reading crypto charts is the first step towards building a profitable trading strategy.”
Identifying Bullish and Bearish Trends
Knowing how to spot bullish and bearish trends in the crypto market is key for traders. Bullish trends show a market going up, with prices making new highs and lows. Bearish trends, on the other hand, show a market going down, with prices making lower highs and lows. It’s important to understand these trends to make smart trading choices and avoid losses.
Deciphering Bullish Trends
Bullish trends in crypto are easy to spot. They have higher highs and higher lows, showing more people are buying. When a crypto’s price keeps hitting new highs, it’s a sign of a bullish trend. Also, if the price drops but stays above the last low, it shows the trend is still up.
Recognizing Bearish Trends
Bearish trends are different. They have lower highs and lower lows, showing a market in decline. If a crypto’s price can’t reach new highs and instead makes lower peaks, it’s bearish. Also, if the price drops below previous lows, it means more people are selling, leading to a possible drop in price.
| Bullish Trends | Bearish Trends |
|---|---|
| Higher Highs | Lower Highs |
| Higher Lows | Lower Lows |
| Increasing Buying Pressure | Increasing Selling Pressure |
| Rising Market Sentiment | Declining Market Sentiment |
Understanding bullish and bearish trends helps traders make better crypto trading decisions. It lets them spot market trends crypto that could affect their investments. Knowing these trends is vital for success in the fast-changing world of crypto.
Recognizing Consolidation and Breakout Patterns
As a savvy crypto trader, it’s key to spot both bullish and bearish trends. Also, knowing consolidation and breakout patterns is vital. Consolidation happens when prices move less, showing a sideways trend. Breakouts, on the other hand, hint at a shift in market mood and price direction. Learning to spot these patterns can lead to better predictions and more trading wins in the crypto market.
Consolidation patterns show a tight range of price changes, with prices stuck between support and resistance. This calm before the storm can lead to a big move. Patterns like triangles, flags, and pennants offer clues about the market’s mood.
Breakout patterns happen when prices cross a key level, often with more trading activity. These can signal a new trend or the continuation of the current one. Spotting these breakouts can unlock many trading opportunities crypto enthusiasts seek.
To spot crypto consolidation patterns and crypto breakout patterns, keep a close eye on market signals. Understanding what drives price changes is crucial. By improving at recognizing these patterns, you’ll make smarter trading choices and thrive in the crypto world.
“Recognizing consolidation and breakout patterns is like deciphering the market’s whispers – it gives you the power to anticipate and ride the waves of price movements.”
The crypto market is always changing, so staying alert and flexible is essential for success. By mastering identifying market signals and seizing trading opportunities crypto, you’ll become a skilled crypto trader.
The Role of Volume in Crypto Trading
Volume is key in crypto trading. It shows how much is being traded in a set time. This helps us understand the market’s health and trends.
Looking at crypto trading volume helps traders see if prices are real. It shows when assets are being bought or sold. High trading volume means more people are trading, making it easier to buy and sell without big price changes.
Low trading volume in some cryptos can make the market less stable. This can lead to big price swings. Tools like On Balance Volume (OBV) and the Money Flow Index (MFI) help spot these trends.
It’s important to know about volume patterns. Increasing volume means more people are interested, which can push prices up. But, decreasing volume might mean prices are about to drop.
Using crypto trading volume in strategies helps traders understand the market better. This way, they can make smarter choices about when to buy, sell, or hold their assets.
“Mature markets with significant volume and good price discovery have less volatility. The wider the spread between offers and bids, the less efficient a market and therefore the more volatile.”
The Impact of Market Cap on Crypto Trends
Understanding market capitalization, or market cap, is key in the world of cryptocurrencies. It shows the size, stability, and market position of a digital asset. This knowledge helps in making smart investment choices.
The market cap is found by multiplying the current price by the total coins or tokens in circulation. It shows how big a cryptocurrency is in the market. Big market caps usually mean a cryptocurrency is more stable and less likely to swing wildly.
The cryptocurrency market cap greatly affects market trends and how investors plan their strategies. For example, a rising market cap often means a bull market. This is when people tend to buy and hold cryptocurrencies for growth. On the other hand, a falling market cap might signal a bear market. This could make investors more careful with their investments.
Watching the market cap of different cryptocurrencies can give you insights into the crypto market’s health. It helps spot good investment chances and guides you through the changing cryptocurrency market trends.
| Cryptocurrency | Market Cap | Price per Coin |
|---|---|---|
| Bitcoin (BTC) | $1.34 trillion | $67,834 |
| Ethereum (ETH) | $425 billion | $3,525 |
| Tether (USDT) | $112 billion | $1.00 |
Knowing how cryptocurrency market capitalization affects market trends helps you craft good investment strategies. This way, you can better handle the ups and downs of the cryptocurrency world.
“The crypto market cap serves as an indicator of the current market trend, with a rising cap signaling a bull market and a falling cap indicating a bear market.”
Using Technical Analysis in Cryptocurrency Trading
Technical analysis is a key tool in cryptocurrency trading. It helps you understand trends and make smart decisions. By looking at past prices and patterns, you can spot opportunities and manage risks.
Technical analysis assumes all important info is in the price. By studying past data, you can guess future price changes. This helps you make better choices and control your risks.
- Trends: Analysts find trends in prices, like rising or falling. Knowing these trends helps you decide when to buy or sell.
- Indicators: Tools like charts and moving averages help spot trends and key levels. Popular tools include the Relative Strength Index (RSI) and Bollinger Bands.
- Chart Patterns: Patterns like support and resistance levels offer clues about future prices. They can show when to buy or sell.
Using technical analysis can boost your profits in the crypto market. But, it’s not the only way to succeed. Combine it with other strategies and fundamental analysis for the best results.
“Technical analysis emphasizes that all relevant information about a cryptocurrency is already reflected in its price. By studying historical data, traders can uncover valuable insights about market sentiment and potential future price movements.”
Getting good at crypto technical analysis takes time and effort. But, it offers valuable insights for navigating the crypto market. Keep improving your strategies, stay flexible, and always manage your risks.
Conclusion
Learning to read and understand crypto chart is key for anyone in the investing in cryptocurrency world. Knowing the basics of crypto, different chart types, and trading strategies helps a lot. It lets you spot trends and patterns in the market.
With hard work, practice, and a desire to learn, you can unlock the power of crypto charts. This way, you can make smart, profitable trades. The crypto market keeps changing, so stay open to new things, keep learning, and improve your skills. The journey to crypto chart mastery is yours to take.
By becoming good at market analysis with crypto charts, you’re ready for the fast-changing crypto world. Start your journey and let your quest for crypto chart skills lead you to success in investing in cryptocurrency.
FAQ
What is cryptocurrency?
Cryptocurrency is a digital money that uses secret codes for safety. It’s different from regular money because it doesn’t need banks and isn’t made of anything physical. Bitcoin started it all, and now there are many other digital coins.
Why are crypto charts important?
Crypto charts help you understand trends in digital money. They let you see patterns and when to buy or sell. This knowledge is key for making smart trades and investments.
What are the different types of crypto charts?
There are mainly three types of crypto charts: line, bar, and candlestick. Line charts show closing prices over time. Bar charts add opening and closing prices. Candlestick charts show the full price range, giving a detailed view.
What are the key elements to look for in a crypto chart?
Important things to look at in crypto charts include price levels and support and resistance lines. Also, trading volume, trends, and patterns are crucial for understanding the market.
How can candlestick patterns help with crypto technical analysis?
Candlestick patterns, like doji and hammer, help spot price changes and market feelings. They show when trends might change or keep going.
How can you identify bullish and bearish trends in the crypto market?
Bullish trends go up, with higher highs and lows. Bearish trends go down, with lower highs and lows. Knowing these trends helps you decide when to buy, sell, or hold.
What is the role of trading volume in crypto charts?
Trading volume shows how much is being traded. It helps confirm price changes and spot when prices might move. It also shows market interest and potential price changes.
How does market capitalization impact crypto trends?
Market capitalization, or market cap, shows a coin’s size and dominance. It helps you see if a coin is growing or stable. Knowing this can guide your investment choices and find good opportunities.
How can technical analysis be used in cryptocurrency trading?
Technical analysis uses past price data and patterns to find trends and opportunities. It helps you spot support and resistance levels. Using it can lead to better trading decisions, risk management, and profits.
Source Links
- Complete Beginner’s Guide to Reading Crypto Charts – https://coinbureau.com/education/how-to-read-a-crypto-chart/
- How to Read Crypto Charts? A Comprehensive Guide – https://www.bitdegree.org/crypto/tutorials/how-to-read-crypto-charts
- Crypto Technical Analysis: Techniques, Indicators, and Applications – https://onetrading.com/blogs/crypto-technical-analysis-techniques-indicators-and-applications
- How To Read Crypto Candlestick Charts | Ledger – https://www.ledger.com/academy/crypto-candlestick-charts-explained
- What Charts Should Crypto Investors Use? – https://www.investopedia.com/charts-for-crypto-6500665
- How to Read Crypto Charts — A Beginner’s Guide – https://crypto.com/university/how-to-read-crypto-charts
- How to Read Cryptocurrency Charts – https://www.morpher.com/blog/how-to-read-cryptocurrency-charts
- Top Chart Patterns For Crypto Trading – https://changelly.com/blog/crypto-chart-patterns/
- Chart Patterns – https://altfins.com/knowledge-base/chart-patterns/
- What Are the Key Chart Patterns Used by Crypto Traders? – Kriptomat – https://kriptomat.io/finance-investing/what-are-the-key-chart-patterns-used-by-crypto-traders/
- Brief Insight on How to Read Cryptocurrency Charts – https://www.lcx.com/brief-insight-on-how-to-read-cryptocurrency-charts/
- How to Read Crypto Charts | DiscoverDataScience.org – https://www.discoverdatascience.org/articles/how-to-read-crypto-charts/
- Six Must-Know Candlestick Patterns In Crypto Trading – https://coinwofficial.medium.com/six-must-know-candlestick-patterns-in-crypto-trading-d4fb20351c40
- Understanding Basic Candlestick Charts – https://www.investopedia.com/trading/candlestick-charting-what-is-it/
- How to Read and Understand Crypto Charts: A Comprehensive Guide – https://www.bitget.com/wiki/how-to-read-and-understand-crypto-charts
- Utilizing Line Charts in Crypto Trading – https://www.altrady.com/crypto-trading/technical-analysis/line-charts-usage
- A Guide to Crypto Chart Patterns to Improve Your Trading – https://www.bitdegree.org/crypto/tutorials/crypto-chart-pattern-guide
- The Anatomy of Trading Breakouts – https://www.investopedia.com/articles/trading/08/trading-breakouts.asp
- Understanding Crypto Trading Volume & Its Significance – https://learncrypto.com/knowledge-base/how-to-trade-crypto/understanding-crypto-trading-volume
- Cryptocurrency Volume Trading: Insights & Tips | Learning (EN) – https://www.kvarnx.com/content/cryptocurrency-volume-trading-insights-tips
- The Crypto Market Cap: A Guide for Beginners – https://www.coursera.org/articles/crypto-market-cap
- What is the Overall Cryptocurrency Market Cap? | The Motley Fool – https://www.fool.com/investing/stock-market/market-sectors/financials/cryptocurrency-stocks/market-cap/
- What is Technical Analysis? Can I Read Crypto Charts? – https://www.coinjar.com/learn/what-is-technical-analysis
- Technical Analysis for Bitcoin and Other Crypto | Gemini – https://www.gemini.com/cryptopedia/technical-analysis-bitcoin-and-crypto
- Crypto Technical Analysis: How to Read Cryptocurrency Charts – https://www.linkedin.com/pulse/crypto-technical-analysis-how-read-cryptocurrency-charts-kamwana-pbsgf
- How to Read a Bitcoin Depth Chart | River Learn – Bitcoin Markets – https://river.com/learn/how-to-read-a-bitcoin-depth-chart/
- Crypto Charts 101: How to read cryptocurrency charts – https://blog.nebeus.com/crypto-charts-101-how-to-read-cryptocurrency-charts/
- How to Read Cryptocurrency Charts: Technical Analysis | PrimeXBT – https://primexbt.com/for-traders/how-to-read-bitcoin-charts/